Tips & Advice
Last Updated: Oct 06, 2021
Kitchener-Waterloo Real Estate Market Facts
September 2021 Housing Market Stats
| Average Home Price | % Change | Homes Sold | % Change |
| $792,599 | +24.2% | 506 | -32.10% |
Kitchener-Waterloo Housing Style Stats
| Detached | Semi-Detached | Townhouse | Condo | |||||
| Price | Units | Price | Units | Price | Units | Price | Units | |
| January | 853,945 | 201 | 626,512 | 21 | $ 566,345 | 56 | 383,196 | 71 |
| February | 910,126 | 337 | 684,787 | 47 | $ 609,566 | 112 | 415,322 | 101 |
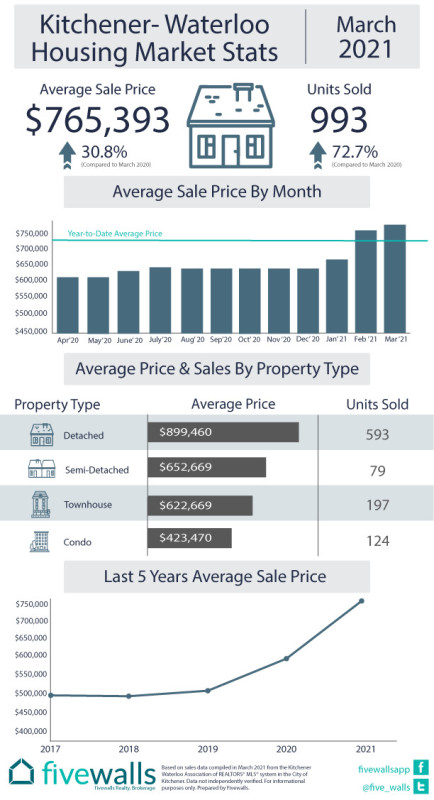
| March | 899,460 | 593 | 652,669 | 79 | $ 622,258 | 197 | 423,470 | 124 |
| April | 899,315 | 484 | 652,609 | 67 | $ 612,550 | 181 | 441,887 | 111 |
| May | 868,990 | 485 | 659,975 | 74 | $ 601,987 | 188 | 457,935 | 106 |
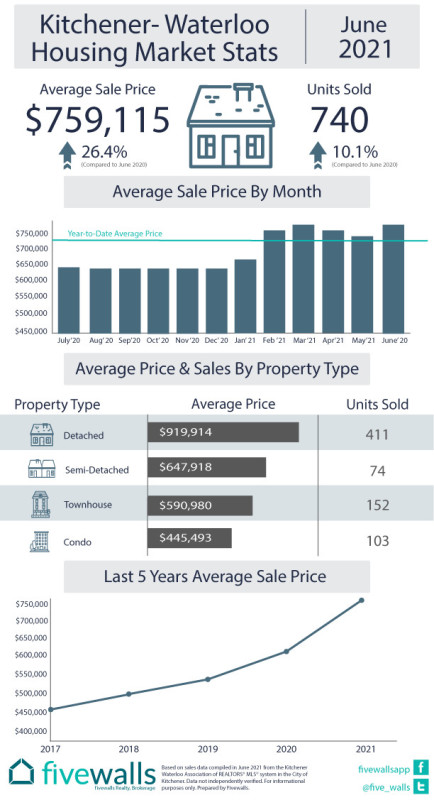
| June | 919,914 | 411 | 647,918 | 74 | $ 590,980 | 152 | 445,493 | 103 |
| July | 907,192 | 339 | 667,570 | 46 | $ 623,732 | 135 | 429,630 | 91 |
| August | 895,756 | 299 | 683,048 | 38 | $ 623,767 | 118 | 445,280 | 80 |
| September | 963,646 | 267 | 686,316 | 41 | $ 646,026 | 115 | 497,949 | 83 |
July 2021

June 2021
May 2021

April 2021

March 2021
February 2021

January 2021


